
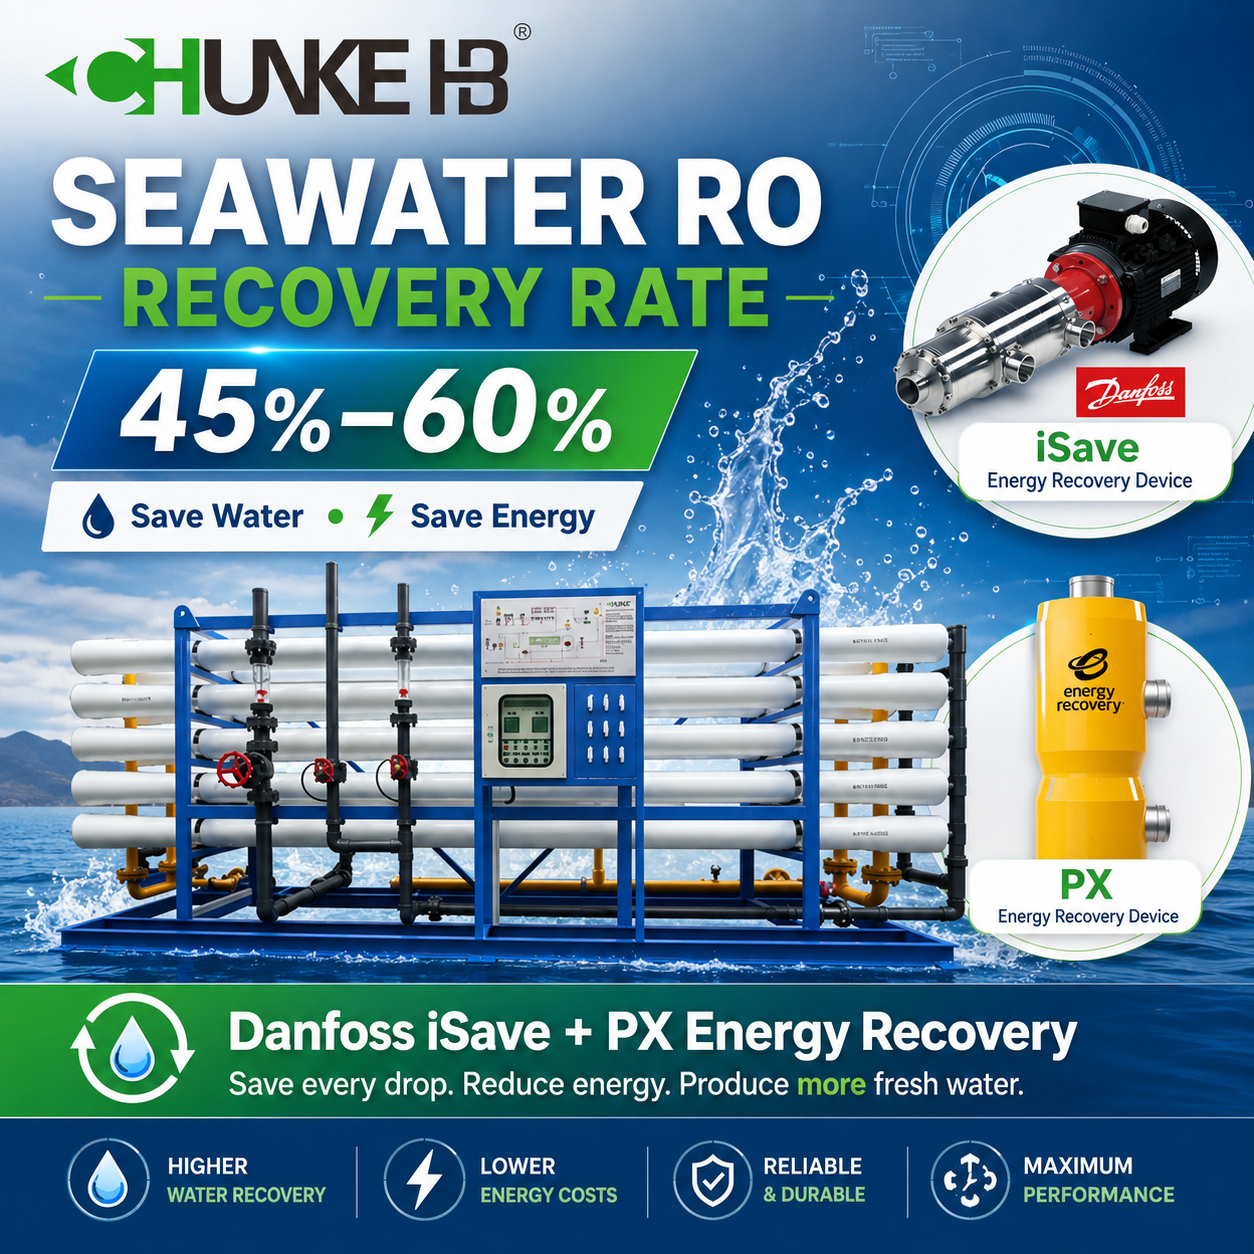
Seawater RO recovery rate explained simply: it is the share of feed seawater converted into fresh water. SWRO systems typically reach 35 to 45 percent. Brackish water RO can reach up to 85 percent. Getting this number right decides your energy cost, membrane life, and daily water output. Chunke Water Treatment engineers every system around the correct recovery rate for your feed water, not a generic industry default. This guide explains the science, then shows how to get a system sized correctly for your project.
What Is Recovery Rate?
Recovery rate is the fraction of feed water that becomes usable fresh water, called permeate. The rest leaves the system as concentrate, or brine. The formula is simple. Recovery rate equals permeate flow divided by feed flow, expressed as a percentage.
For example, a system running 45 percent recovery on 100 m³/h of feed seawater produces 45 m³/h of fresh water. The remaining 55 m³/h leaves as concentrate. Higher recovery means more fresh water from the same feed source. This lowers intake pumping cost. It also reduces the environmental footprint of brine discharge.
Typical Recovery Rate by System Type
The table below shows typical recovery rate ranges Chunke designs for, based on feed water type and system capacity.
| System Type | Typical Recovery Rate | Limiting Factor |
|---|---|---|
| SWRO (seawater) | 35–45% | Osmotic pressure and energy limit |
| SWRO with energy recovery device | 40–50% | Pump and ERD design margin |
| BWRO (brackish water) | Up to 85% | Scaling and antiscalant dosing |
| Chunke 100–500 LPH systems | 35–40% | Compact skid design |
| Chunke 1000–8000 LPH systems | 40–55% | Membrane staging, ERD option |
| Chunke 25 m³/h–50 TPH systems | 40–60% | Multi-vessel array design |
These numbers are starting references. Chunke confirms the exact figure after reviewing your feed water analysis. Real seawater varies by TDS, temperature, and season, so the final design number can shift slightly from this table. Ask Chunke’s team for a project-specific recovery rate estimate before you finalize a budget. Generic brochure numbers rarely match actual site conditions.
What Limits Recovery Rate: Scaling and Osmotic Pressure
Two forces cap how high recovery rate can safely go. The first is scaling. As water passes through the membrane, dissolved minerals concentrate in the remaining stream. Engineers use a concentration factor formula to predict this buildup: CF equals 1 divided by 1 minus recovery. At 45 percent recovery, the concentration factor reaches roughly 1.8. Dissolved minerals near the last membrane element then sit at almost twice the feed concentration.
The second limit is osmotic pressure. As seawater concentrates, its osmotic pressure rises. Eventually the pump cannot generate enough pressure to keep pushing water through the membrane. This is the dominant limit for SWRO specifically. Seawater has less scaling tendency than brackish water. However, it starts at much higher osmotic pressure, which caps recovery sooner.
Factors That Affect Your System’s Recovery Rate
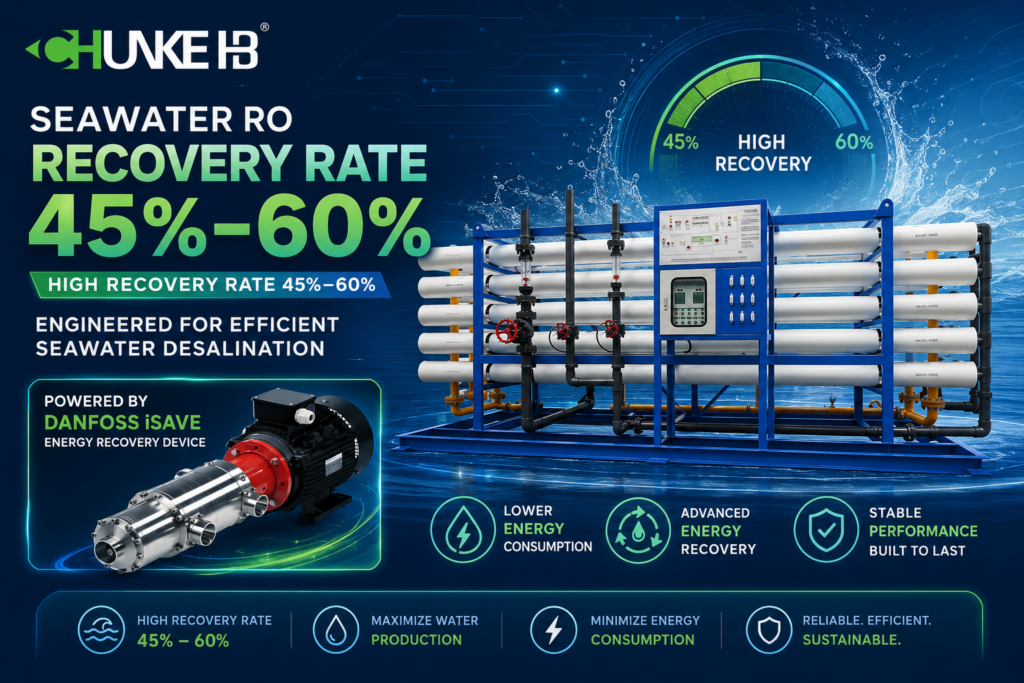
Several project-specific factors shift the achievable recovery rate up or down. Feed water TDS matters most. Higher salinity lowers the safe recovery ceiling, since osmotic pressure starts higher. Feed water temperature also plays a role. Colder water raises viscosity and reduces membrane flux at a given pressure.
Antiscalant dosing extends the scaling limit. This allows higher recovery on the same feed water. Membrane staging and array design matter too. Chunke arranges pressure vessels in series. Concentrate from one stage feeds the next, squeezing out more permeate before final discharge.
Pretreatment quality also affects the achievable number. Poor pretreatment forces operators to run below the theoretical maximum, just to protect the membrane from fouling. A correctly designed SWRO pretreatment system lets the plant safely reach its designed recovery target.
How Chunke Engineers Systems for Higher Recovery Rate
Recovery rate is not just a number on a datasheet. It is an engineering outcome Chunke designs into every seawater RO recovery rate project from day one. The team reviews water analysis and calculates scaling risk. Membrane count and array configuration are then selected to hit the highest safe recovery rate for your budget.
Membrane Selection for Recovery Optimization
Membrane brand and model affect achievable recovery. Chunke offers DuPont FilmTec seawater elements and Vontron SW series membranes. LG Chem seawater elements and Toray Romembra membranes are also available. For higher recovery targets on difficult feed water, Hydranautics high-rejection elements hold performance steady as concentrate salinity rises.
Pumps and Energy Recovery Devices
Recovery rate and energy cost are closely linked. Chunke fits Grundfos or CNP high-pressure pumps for this reason. Danfoss variable frequency drives hold stable pressure as recovery targets shift with the seasons. An energy recovery device raises safe recovery rate further. It recycles pressure energy from the concentrate stream instead of wasting it at the discharge valve.
Automatic Recovery Rate Control
Chunke installs Siemens PLC and touch-screen HMI on every system. Operators can then monitor and fine-tune recovery rate in real time. The panel tracks feed, permeate, and concentrate flow continuously. It alerts operators before recovery rate drifts into unsafe scaling territory.
Recovery Rate vs Energy Use vs Water Quality: The Trade-Off
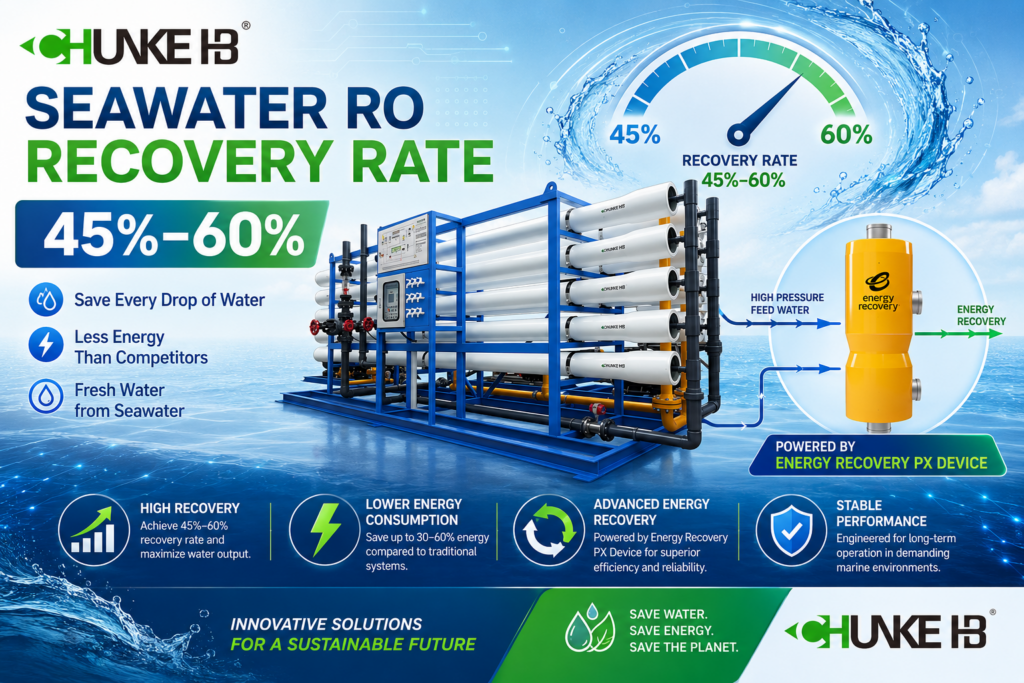
Pushing recovery rate higher is not automatically better. Higher recovery means higher pressure, which raises energy consumption per cubic meter. It also concentrates the feed more. This can push salt passage higher, lowering permeate quality near the end of the membrane array.
Chunke calculates the optimal balance for each project. The team does not default to the highest number possible. This protects your water quality target and your monthly electricity bill together. As a result, the system performs well for its entire service life, not just on day one.
How Recovery Rate Sizing Protects Your Investment
Correct recovery rate sizing is not just a technical detail. It is what separates a plant that runs reliably for fifteen years from one that needs early membrane replacement. Chunke treats this calculation as core engineering work, included with every quotation at no extra charge.
Clients who buy from equipment traders instead of manufacturers often receive a recovery rate number with no calculation behind it. Chunke’s engineering team works differently. Every quoted number comes with the water analysis, scaling index, and membrane array design that support it. This transparency protects your budget before you ever sign a contract.
How to Calculate the Recovery Rate You Need
Start with your daily water demand. Then work backward to the feed flow your intake must supply. For example, a project needing 500 m³/day at 40 percent recovery needs 1,250 m³/day of feed seawater. That number drives intake pump sizing, pretreatment capacity, and concentrate discharge design.
This calculation only works with accurate feed water data. Chunke recommends a full water analysis before finalizing any recovery rate target. Key data includes TDS, temperature, and scaling-relevant ions. Send your water analysis to Chunke’s engineering team. They will confirm a realistic recovery rate for your project, matched to a system in the SWRO systems lineup.
Common Recovery Rate Mistakes That Cost Buyers Money
Some suppliers quote an unrealistically high recovery rate to win business with a lower headline price. The system then scales or fouls within months. This is one of the most common ways buyers end up with an underdesigned plant. Chunke never quotes a recovery rate the pretreatment and membrane design cannot actually support.
Another mistake is ignoring seasonal feed water changes. A recovery rate that works in cool winter water may push scaling risk too high in summer. Higher temperature and evaporation raise salinity during warmer months. Chunke designs a safety margin into every quoted recovery rate, so performance stays stable across the full year.
Monitoring Recovery Rate After Installation
Recovery rate is not a set-and-forget number. Feed water quality shifts with the seasons, rainfall, and nearby human activity. Chunke’s PLC logs recovery rate continuously, so operators see any drift long before it becomes a problem. This ongoing visibility is one more reason clients pick a manufacturer with strong automation. A supplier offering only basic manual controls cannot match it.
Regular water sampling backs up this automatic monitoring. Chunke recommends checking feed TDS and scaling indices every few months. This matters most for projects near ports, rivers, or areas with seasonal algae blooms. Clients on a service contract get this review included, along with recommendations if the recovery rate target needs adjustment.
What’s Included When You Buy a Recovery-Optimized System From Chunke
Every Chunke SWRO system ships with the recovery rate calculation used in its design, not just a headline number. So, clients receive factory test data confirming the plant hits its rated recovery rate before it ever leaves China. This gives buyers proof of performance, not just a promise on paper.
Support does not stop at delivery. Chunke provides installation guidance, operator training, and ongoing technical support for recovery rate troubleshooting. Spare membranes, pumps, and control parts are available for every capacity Chunke manufactures. This way, a recovery rate issue never turns into weeks of downtime.
Why Work With Chunke to Get the Right Recovery Rate
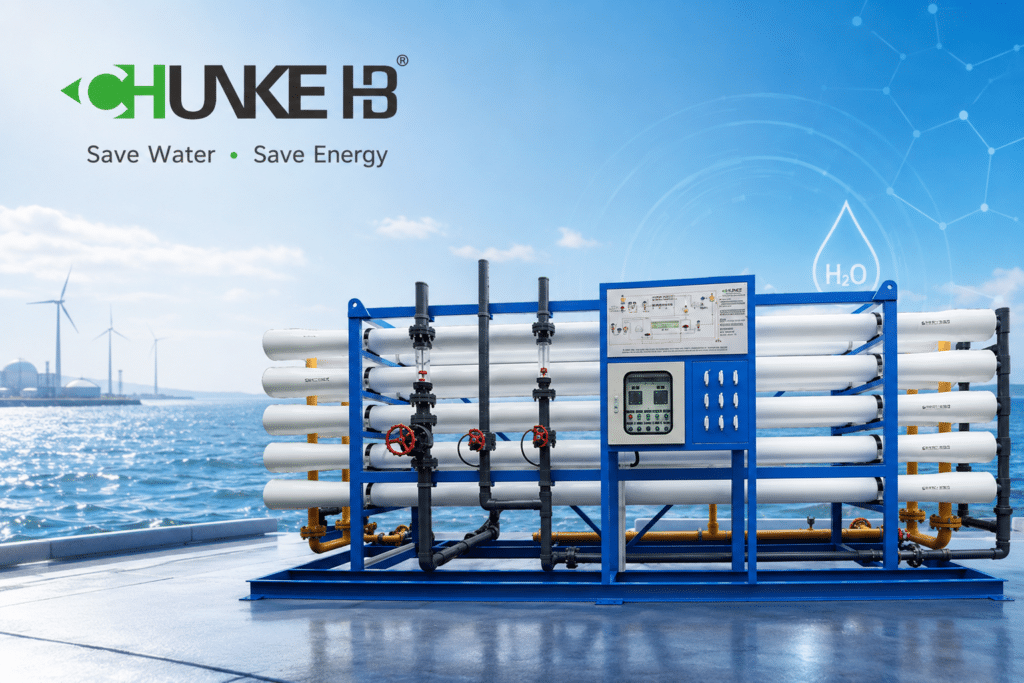
Chunke Water Treatment designs and manufactures every seawater RO system in Guangzhou, China. Recovery rate is calculated specifically for your feed water, never copied from a generic brochure. This engineering-first approach is why clients across island, hotel, industrial, and marine projects choose Chunke. Suppliers who only resell equipment from a catalog cannot match this level of detail.
Explore Chunke’s full capacity range. Options span the 8000 LPH seawater desalination plant up to the 25 m³/h SWRO system. Each one is engineered with a recovery rate matched to real feed water data. Compact projects can also review the containerized SWRO system guide. Clients weighing feed water type can compare options on the SWRO vs BWRO difference post.
For further reading, see Chunke Water Treatment’s industrial RO systems page. Also check Chunke RO Water Plant’s guide on RO concentrate and water waste. Both resources expand on recovery rate and concentrate management.
Ready to size a system with the correct recovery rate for your project? Fill in the contact form below. Send your water analysis too, if you have one on hand. Chunke’s engineering team replies to every enquiry within 24 hours. Each reply includes a recovery rate calculation. It comes with a technical proposal built around your actual feed water, not a generic estimate.
Frequently Asked Questions
Recovery Rate in the Field: How Chunke Sizes Real Projects
Consider a coastal resort needing 300 m³/day of fresh water from seawater at 38,000 mg/L TDS. Chunke first confirms the feed water analysis. The team then calculates a safe recovery rate near 40 percent for that salinity and temperature range. This sets the required intake flow at roughly 750 m³/day. That number drives the pump, pretreatment, and membrane count for the final design.
A second example: an industrial client needing 1,000 m³/day of process water from cooler, lower-salinity seawater. Lower temperature and salinity allow Chunke to design closer to 44 percent recovery. This reduces the required intake flow and lowers pump and pretreatment cost. Every project gets this same calculation, whether the order is for one unit or a multi-container installation.
1. What is a good seawater RO recovery rate?
Most SWRO systems run safely between 35 and 45 percent recovery. Chunke can push this higher with energy recovery devices and stronger pretreatment, depending on feed water quality.
2. Why can’t SWRO reach the same recovery rate as BWRO?
Seawater starts with much higher osmotic pressure than brackish water. This limits how much can be recovered before the pump can no longer overcome the concentrated stream’s rising pressure.
3. Does a higher recovery rate save money?
Sometimes, but not always. Higher recovery reduces intake and pretreatment cost. However, it raises energy use and scaling risk. Chunke calculates the true optimal point for each project.
4. How does antiscalant dosing affect recovery rate?
Antiscalant keeps dissolved minerals from precipitating as the concentrate stream gets stronger. So, correct dosing lets a system safely run at a higher recovery rate than untreated feed water allows.
5. Can I increase recovery rate on an existing system?
Sometimes, if pretreatment and antiscalant dosing have spare capacity. Chunke reviews existing system data before recommending any recovery rate increase, to avoid pushing the plant into scaling risk.
6. What water analysis does Chunke need to calculate my recovery rate?
Chunke typically needs feed TDS, temperature, pH, and key scaling ions such as calcium, sulfate, and silica. Send this data with your target capacity for an accurate recovery rate proposal.
7. Does Chunke guarantee the quoted recovery rate?
Yes. Chunke backs every quoted recovery rate with factory test data before shipment. If actual feed water differs significantly from the water analysis provided, the team revisits the design together with the client.

Comments are closed for this post.