
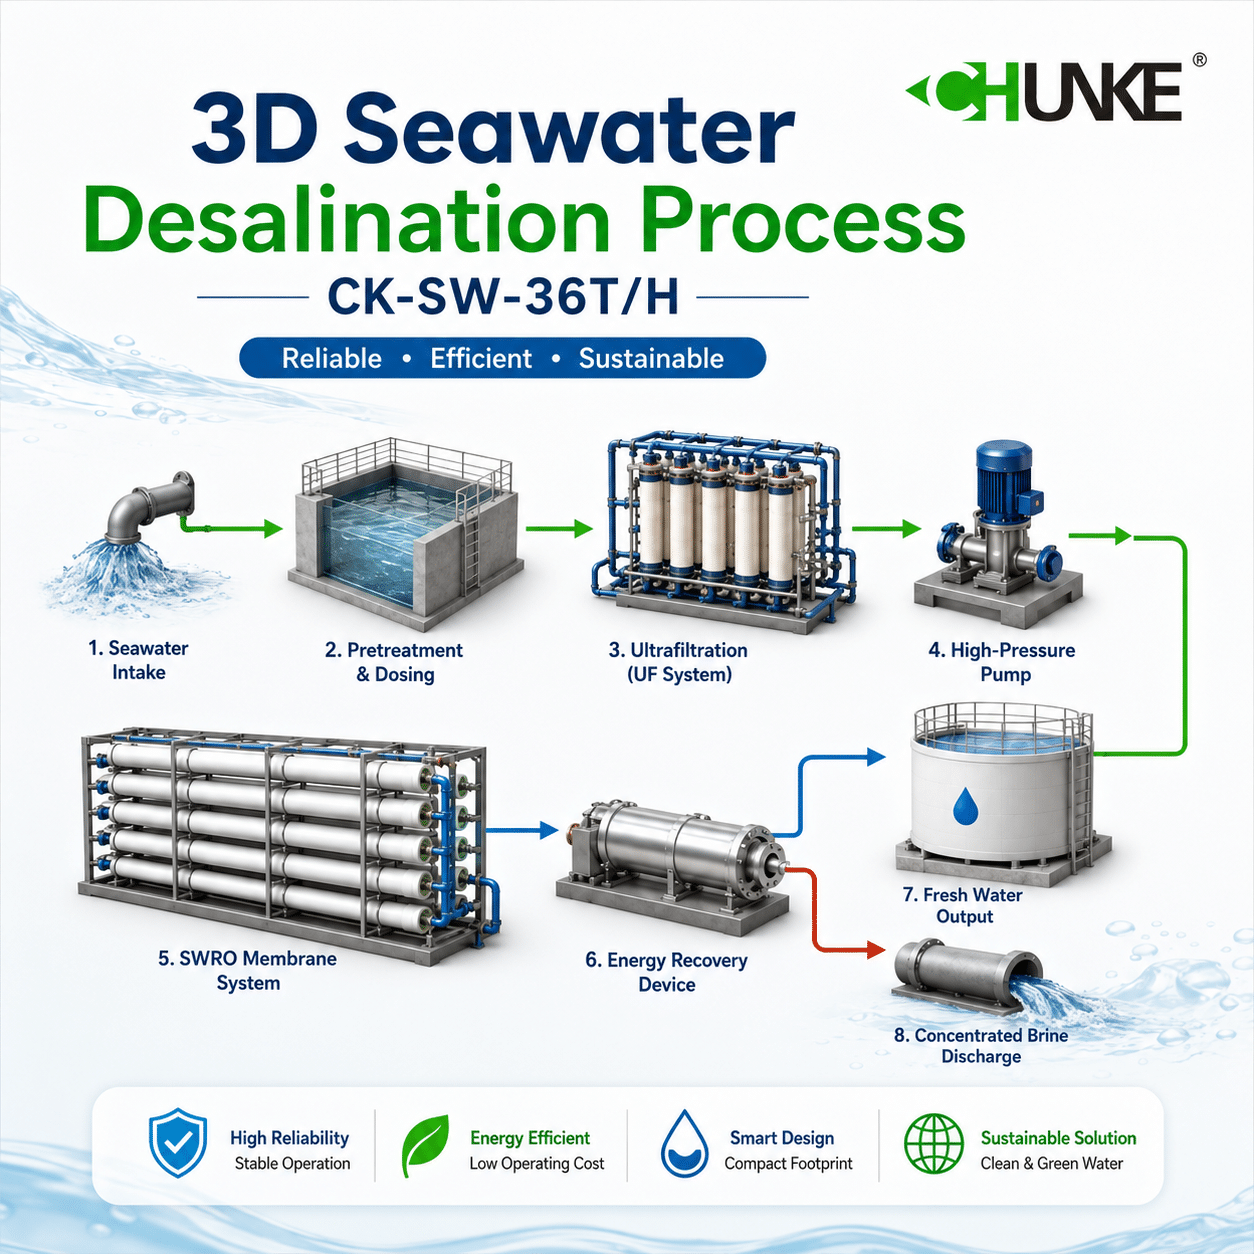
A seawater desalination process diagram maps every stage an SWRO plant needs to turn raw seawater into safe drinking water. Feed seawater often carries 35,000 to 45,000 ppm of total dissolved solids. A well-built SWRO system cuts that number below 350 ppm. Modern plants also run on just 3.5 to 4.5 kWh of energy per cubic meter. Engineers use this diagram to size intake lines, pumps, membranes, and control panels correctly. Procurement teams use it to compare suppliers on equal terms. So, let’s walk through each stage in order.
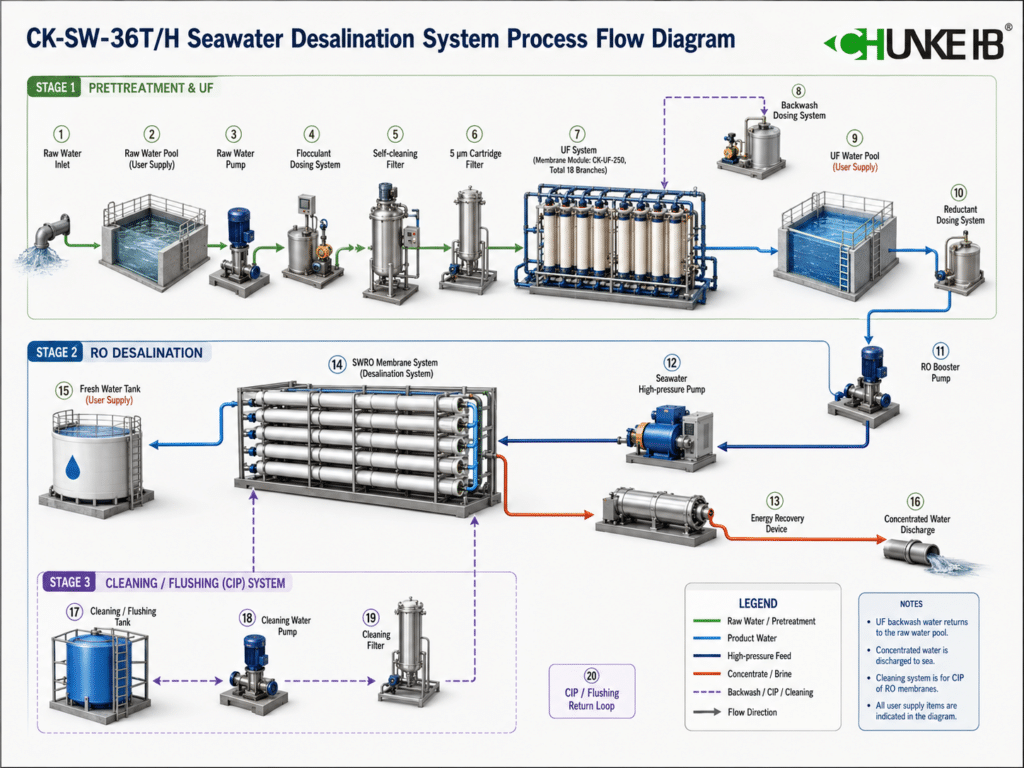
What the Seawater Desalination Process Diagram Shows
A complete SWRO diagram covers six main stages. First, seawater enters through an intake system. Next, pretreatment removes solids and organics from the feed. Then, high-pressure pumps push water through the RO membranes. Meanwhile, an energy recovery device reclaims pressure from the reject stream. After that, post-treatment adjusts pH and adds minerals back. Finally, the system stores and distributes the finished water. Each stage appears as one clear block on the diagram. Therefore, engineers can size every pump, membrane, and pipe correctly. Buyers can also spot design gaps before signing a purchase order. So, a good diagram saves money long before construction starts.
How to Read the Diagram Symbols
A standard SWRO diagram uses simple, consistent symbols. Circles usually represent pumps of different types and sizes. Rectangles mark filters, membrane vessels, or storage tanks. Triangles typically mark valves that control flow direction. Small gauge icons show pressure and flow measurement points. Arrows trace the water path from intake to final storage. Dashed lines often represent electrical or control signal wiring. Meanwhile, solid lines always represent actual pipework carrying water. Color coding also helps separate feed, permeate, and reject streams. Blue usually marks feed water entering the system. Green often marks clean permeate leaving the membrane stage. Red or orange marks the concentrated reject stream instead. So, anyone can follow the diagram without deep engineering training. This clarity helps buyers, contractors, and operators speak the same language.
Stage 1: Seawater Intake and Screening
Every seawater desalination process diagram starts at the intake point. Open intake draws water directly from the sea through a submerged pipe. Alternatively, beach wells filter seawater through natural sand layers first. Coarse bar screens remove seaweed, debris, and marine life early. A traveling band screen then catches smaller floating particles. So, water reaches pretreatment already partly clean. This step protects downstream pumps and membranes from physical damage. As a result, plant owners see fewer maintenance callouts each year. Coastal plants often choose open intake for lower upfront cost. Meanwhile, beach wells suit sites with strict environmental permitting rules. Intake velocity typically stays below 0.1 meters per second. This slow flow protects fish larvae and other marine life nearby.
Stage 2: Pretreatment Removes Solids Before the Membrane
Pretreatment forms the diagram’s second and most critical block. Dual-media filters remove suspended solids down to about 10 microns. Many modern plants now add ultrafiltration for tighter, steadier control. Our pretreatment systems combine both methods for consistent feed water quality. Cartridge filters then polish the water down to 5 microns. This step protects RO membranes from fouling, scaling, and biological growth. Without proper pretreatment, membrane life can drop sharply within months. Hence, pretreatment quality directly affects long-term operating cost. Our ultrafiltration pretreatment option suits sites with variable seawater turbidity. Operators also track the silt density index at this stage. A low SDI value confirms the membrane feed is clean enough. Dosing pumps add antiscalant here to control calcium and sulfate scaling.
Stage 3: High-Pressure Pumping and RO Membrane Separation
High-pressure pumps sit at the diagram’s core. These pumps push seawater into membrane vessels at 55 to 82 bar. Brands like Grundfos and Danfoss supply proven high-pressure pump lines. Meanwhile, CNP pumps offer a cost-effective option for mid-size plants. Inside each vessel, spiral-wound membranes reject dissolved salts continuously. Trusted membrane brands include DuPont, Hydranautics, Toray, Vontron, and LG. Our SWRO membrane systems use these brands depending on project budget and feed chemistry. As a result, product water TDS typically falls below 350 ppm. Recovery rate usually ranges between 35 and 45 percent for seawater feed. Most pressure vessels hold six or seven membrane elements in series. Salt rejection across each element usually exceeds 99.7 percent. Feed pressure rises automatically as membranes age and foul slightly. So, the control system tracks pressure trends to flag cleaning needs early.
Stage 4: Energy Recovery Cuts the Power Bill
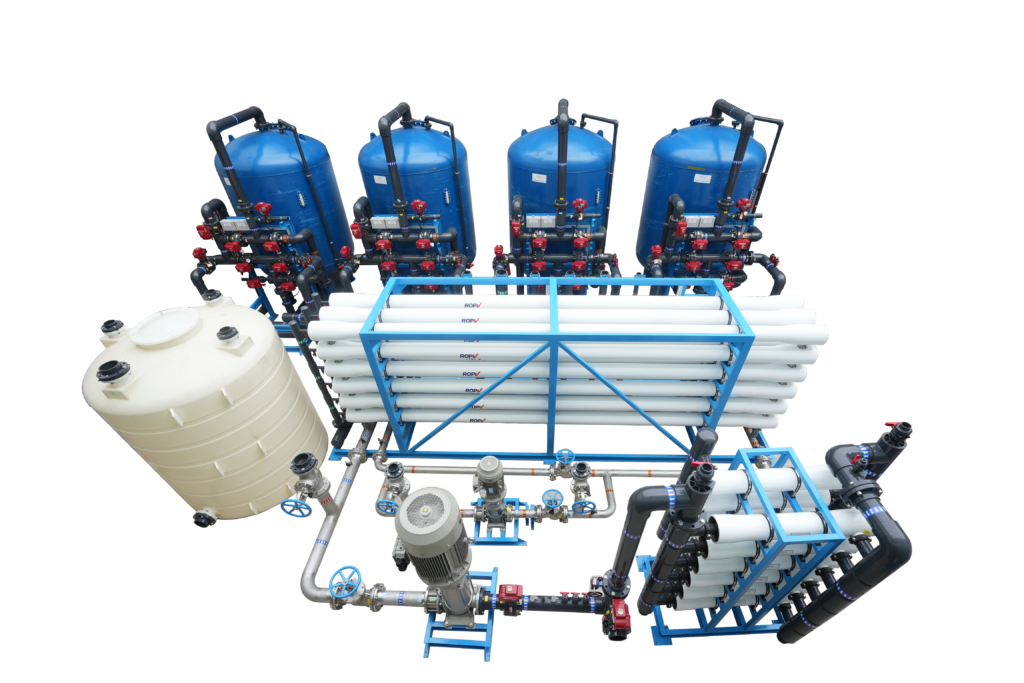
Energy recovery marks the diagram’s efficiency stage. The reject stream still holds most of the pump’s original pressure. A pressure exchanger transfers that leftover energy back into incoming feed water. Consequently, overall energy use drops from roughly 6 kWh/m³ to 3.5 to 4.5 kWh/m³. This single device can cut power costs by 40 percent or more. Therefore, energy recovery often pays for itself within a few years. Larger plants almost always include this stage in their diagram. Smaller containerized units sometimes skip it to lower upfront price. Pressure exchangers now reach efficiency levels above 95 percent. So, very little pump energy actually goes to waste.
Stage 5: Post-Treatment and Remineralization
Post-treatment sits near the end of the diagram. Fresh water leaving the membrane stage lacks essential minerals. So, operators dose calcium carbonate and adjust pH before distribution. This step prevents pipe corrosion and improves the final taste. Chlorination or UV disinfection then guards against bacterial regrowth. Finally, the finished water meets WHO drinking water guidelines. Hotels, islands, ships, and municipalities all require this finished quality. Some plants also inject food-grade CO2 to stabilize pH levels. This combination keeps the water safe across long distribution networks.
Stage 6: Storage, Control, and Distribution
The final diagram block covers storage and control. Treated water flows into storage tanks for later use. Meanwhile, a PLC and HMI panel monitor every stage in real time. Siemens control systems handle automation for many Chunke projects. Remote monitoring lets operators check pressure, flow, and quality from anywhere. Our SWRO control systems integrate every signal into one simple interface. Consequently, plant staff react quickly to any alarm or fault. Distribution pumps then send fresh water to the final storage point. SCADA screens also log historical trends for every sensor. So, engineers can review performance data months after commissioning. This history also helps diagnose problems during warranty claims.
Seawater Desalination Process Diagram: Technical Specifications
The table below summarizes typical values shown across the diagram. Actual numbers shift slightly with feed water temperature and salinity.
| Parameter | Typical Value |
|---|---|
| Capacity range | 100 LPH – 500 m³/h |
| Feed water TDS | 35,000 – 45,000 ppm |
| Product water TDS | < 350 ppm |
| Recovery rate | 35% – 45% |
| Operating pressure | 55 – 82 bar |
| Specific energy consumption | 3.5 – 4.5 kWh/m³ |
| Membrane type | Spiral-wound thin-film composite |
| Energy recovery device | Pressure exchanger, up to 95%+ efficiency |
| Control system | PLC + HMI, remote monitoring |
| Configuration | Skid-mounted or containerized |
Water Quality Standards This Diagram Must Meet
Buyers ship SWRO plants to many different countries. So, each diagram must satisfy local drinking water rules. WHO guidelines set a common global baseline for product water. Many island and resort clients also request US EPA limits. Meanwhile, some African and Middle Eastern buyers follow local ministry standards instead. Chunke plants shipping within China follow the GB 5749-2022 standard. This standard sets strict limits on TDS, hardness, and microbial content. Consequently, our post-treatment stage adjusts easily between these different targets. Engineers simply change dosing rates rather than redesigning the whole plant. This flexibility saves time on multi-country export orders. It also keeps compliance documentation simple for customs and inspection.
How to Size Your Plant from the Diagram
Sizing starts with your daily water demand in cubic meters. Next, add a safety margin for peak season or downtime. Then, match that number against standard capacity blocks in the diagram. Small resorts often need 250 to 1000 liters per hour. Mid-size industrial sites often choose the 25 m³/h configuration instead. Large municipal projects may require multiple parallel trains above 500 m³/h. Meanwhile, membrane count and pump size scale directly with capacity. So, the diagram becomes a simple planning tool for any project size. Chunke engineers can size your plant within one business day. Just share your feed water TDS and required daily output.
Common Diagram Variations: Containerized, Skid-Mounted, and Solar-Hybrid
Not every SWRO diagram looks identical in layout. Skid-mounted systems fit compact frames for indoor installation. Containerized plants add a full enclosure for outdoor, remote deployment. Islands and disaster-relief sites often prefer the containerized configuration. Meanwhile, solar-hybrid diagrams add photovoltaic panels ahead of the pump stage. This variation suits off-grid locations without stable grid power. Each variation still follows the same six core stages described above. However, equipment layout and enclosure design change based on the site. Consequently, buyers should confirm which variation fits their installation environment. Chunke offers all three configurations across its full capacity range.
Maintenance Points the Diagram Helps You Plan
A good diagram also marks every maintenance access point. Cartridge filters need replacement every four to six weeks typically. Membrane cleaning, called CIP, usually happens every three to six months. Meanwhile, pump seals and bearings need inspection twice a year. The diagram shows exactly where technicians should install sample ports. So, operators can test water quality without shutting down the plant. Planning maintenance around the diagram reduces unexpected downtime significantly. It also helps new technicians learn the plant layout faster. Spare membrane elements and filter cartridges should stay on-site always. This stock prevents long shipping delays from interrupting daily production.
Chunke Builds Every Diagram Stage In-House
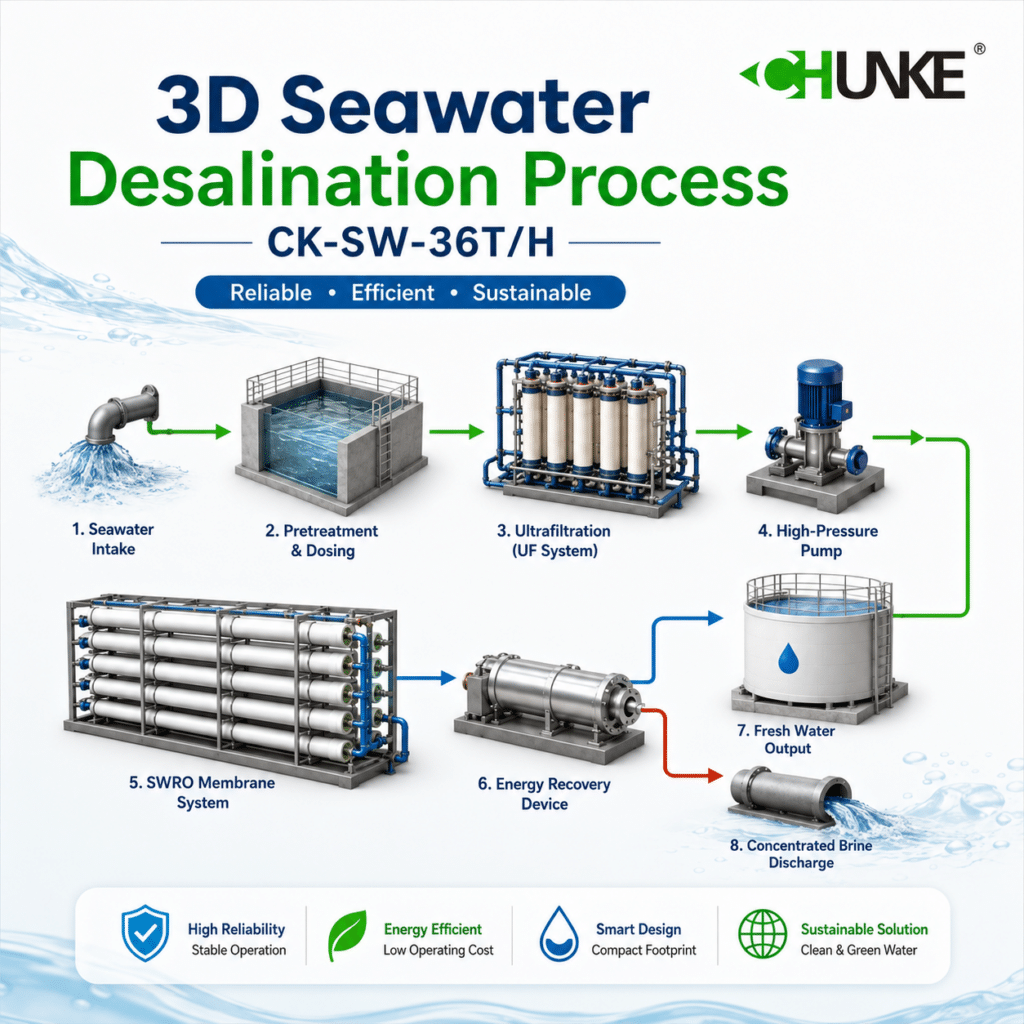
Chunke Water Treatment designs and builds every stage shown above. Our parent brand, Chunke Water Treatment, also supplies industrial and municipal water treatment systems. Meanwhile, our sister site Chunke RO Water Plant focuses on brackish and surface water RO plants. Together, these three sites cover almost every water treatment need. So, clients get one trusted supplier across their whole project. This approach also shortens spare-parts lead time worldwide. Consequently, plant downtime stays low even in remote locations.
Why Buyers Rely on This Diagram Before Ordering
Procurement teams study this diagram before requesting a quote. It shows exactly which components affect price and performance. So, buyers can compare suppliers on equal technical terms. Engineers also use the diagram to plan civil and electrical work. Meanwhile, EPC contractors use it to coordinate installation schedules. As a result, projects move faster with fewer costly surprises. A clear diagram also helps non-technical stakeholders understand the investment. Consequently, approval and budgeting happen much faster internally. Fewer change orders also appear once construction begins.
Chunke SWRO Systems Built From This Diagram
Chunke turns this exact diagram into working plants across many capacities. Our range spans 100 liters per hour up to 500 cubic meters per hour. Smaller sites often choose our 8000 LPH seawater desalination plant for steady daily supply. Larger industrial buyers often prefer our 25 m³/h SWRO system for higher throughput. Every unit ships as a skid-mounted or containerized package. Containerization shortens installation time on remote islands and coastal sites. You can also browse completed SWRO projects across different capacities and regions. For a deeper narrative on each treatment step, read our full desalination process guide.
Frequently Asked Questions
What does a seawater desalination process diagram show?
It shows every treatment stage, from intake to final distribution. Each block represents pumps, membranes, or control equipment. Engineers use it to size and plan the entire plant. Buyers use it to compare suppliers on equal terms.
How much energy does an SWRO plant use per cubic meter?
Modern SWRO plants use 3.5 to 4.5 kWh per cubic meter. Energy recovery devices help keep this figure low. Older plants without recovery often use much more power. So, always check whether your quote includes energy recovery.
What TDS level does SWRO product water reach?
Product water typically falls below 350 ppm total dissolved solids. Feed seawater usually starts near 35,000 to 45,000 ppm. So, the membrane stage removes over 99 percent of salt. Post-treatment then fine-tunes the final mineral balance.
Which membrane brands appear most often in SWRO diagrams?
DuPont, Hydranautics, Toray, Vontron, and LG all supply seawater RO membranes. Chunke selects brands based on project budget and feed water chemistry. Each brand offers similar rejection rates above 99.7 percent. Availability and price often decide the final brand choice.
Why does the diagram include an energy recovery device?
The reject stream still carries most of the pump’s original pressure. An energy recovery device reclaims that pressure for reuse. Consequently, the plant cuts energy costs significantly. Most large-scale SWRO plants include this device today.
Can Chunke customize the diagram for a specific capacity?
Yes, Chunke designs each diagram around actual project requirements. Our team adjusts capacity, membrane count, and automation level. Fill in the form below, and we reply within 24 hours. We can also send a sample diagram before you order.
Get Your Custom Seawater Desalination Process Diagram
Ready to plan your own SWRO project? Share your required capacity, feed water source, and location below. Our engineers will prepare a custom diagram and quotation. We include equipment brands, layout, and estimated delivery time. So, you can move straight from diagram to purchase order. We reply to every inquiry within 24 hours.
